Push and Pull Communication

Push and Pull Communication

Communication in Two Categories

Communication on your project typically falls into two categories, Push Communication and Pull Communication.

Push Communication

Push  communication is sent to people who need to receive the information. It might include:

  • Memos
  • Reports
  • Emails
  • Faxes
  • Voice mails
  • Press releases

We can send it, but that doesn’t mean it has reached them, was interpreted correctly, or was understood by the intended audience.

Pull Communication

Pull communication is where people can access content at their own discretion. Examples include:

  • Web portals,
  • Intranet sites,
  • Self-paced e-learning,
  • Lessons learned databases or knowledge repositories.


See more Project Management Picture Concepts:

You can see what people are saying about David McLachlan here: REVIEWS

Navigate to Free Project Management and Leadership Articles through the links on the right (or at the bottom if on Mobile) 

PMI PMP 35 PDUs CourseThe Ultimate PMP Project Management Prep Course (35 PDUs)
Agile Certified Practitioner (PMI-ACP 21 PDUs)The Complete Agile Course: PMI-ACP (21 PDUs), Coaching, Jira and MORE! 
50 Project Management Templates Gantt Chart Risk Matrix and more Excel50+ Project Management Templates in Excel and PowerPoint (Gantt Chart, Risk Matrix and more!)
Project Management Plan TemplatesPre-made Project Management PLAN Template: Save 100 HOURS!


INVEST for User Story Creation

INVEST for User Stories

A Great Way to Create Agile User Stories

INVEST is an acronym that helps us when creating user stories. In an Agile team, you’ll typically get together in a “Triad” or “The Three Amigos” of the Customer, Developer and Tester, but it can be anyone who needs to have an input.

INVEST stands for:

Independent, Negotiable, Valuable (or Vertical), Estimable, Small and Testable.

Independent

The User Story should be a usable piece that can operate on its own, independent to others, that we can demonstrate at the end of the Sprint.

Negotiable

The User Story should be able to be negotiated in our out of the sprint, or even out of the Product Backlog if it is no longer valuable. We should be able to negotiate the requirements against the solution.

Valuable

The item should have customer value, and be able to be demonstrated.

Estimable

The item’s effort should be able to be estimated by the team.

Small

It should be small enough to be completed in a Sprint (usually around 2 weeks)

Testable

It should be testable – often the team will write the tests (or acceptance criteria) first using “Test Driven Development”.

Learn Project Management and earn 35 PDUs, Learn Agile and earn 21 PDUs, save yourself 100s of hours with the Excel and PowerPoint templates below.

You can see what people are saying about David McLachlan here: REVIEWS

PMI PMP 35 PDUs CourseThe Ultimate PMP Project Management Prep Course (35 PDUs)
Agile Certified Practitioner (PMI-ACP 21 PDUs)The Complete Agile Course: PMI-ACP (21 PDUs), Coaching, Jira and MORE! 
50 Project Management Templates Gantt Chart Risk Matrix and more Excel50+ Project Management Templates in Excel and PowerPoint (Gantt Chart, Risk Matrix and more!)
Project Management Plan TemplatesPre-made Project Management PLAN Template: Save 100 HOURS!


Project Management Key Concepts (in Pictures)

Cost Reserves (Contingency, Management):

Types of Project Benefits (Tangible, Intangible):

Three Types of PMO (Supportive, Controlling, Directive):

Roles on a Scrum Team:

Project Development Lifecycles:

Agile Estimating:

Estimating Types and Ranges:

The Three Cs for creating User Stories:

INVEST for creating User Stories:

Types of Estimating (Analogous, Parametric, 3-point, etc.)

Push Communication and Pull Communication:

The Five Cs of Communication

Resource Smoothing and Resource Levelling:

Schedule Fast Tracking and Schedule Crashing:

Types of Power:

The Cost of Quality:

Cost of Quality

Tuckman’s Ladder (the Tuckman Model for Team Development):

Tuckmans Ladder

Adaptability and Resiliency:

Adaptability and Resiliency

Adaptability and Resiliency

Adaptability and Resiliency

Projects are hard. But they can be easier when you and your team are Adaptable and Resilient.

The good news? You can improve both of these things.

Adaptability is responding positively to changing conditions.

Resiliency is absorbing impacts to recover quickly from a setback.

Having a solid foundation (like an emergency fund in your home Budget, or a career skill that is in high demand) will help you with both.


– David McLachlan

See more Project Management Picture Concepts:

David McLachlan – What People Are Saying

See live comments and reviews on David McLachlan on YouTube, Udemy and Etsy.

Here is what people have to say about David McLachlan:

“THE best instructor I have seen so far for the PMP, he not only gives you the information, but he TRAINS you to get into the mindset required to pass the PMP exam, and also to effectively manage your own project. Amazing course, amazing instructor, I believe in you, and so does David McLachlan.” – Xavier

David McLachlan review

“David McLachlan is one of the most sincere and personable teachers I’ve ever studied under. His positivity is genuinely infectious. It’s clear to me that what he teaches comes from a place of wanting his students to succeed, not just in the exam, but also in the corporate environment.” – Manunath

David McLachlan review

“Passed my PMP first try. In the 3rd section of the exam when I could feel myself getting tired, I imagined how you would read the question and break it down, and I heard your voice and your accent when reading the questions. I can’t recommend this (David McLachlan course) enough.” – John

David McLachlan review

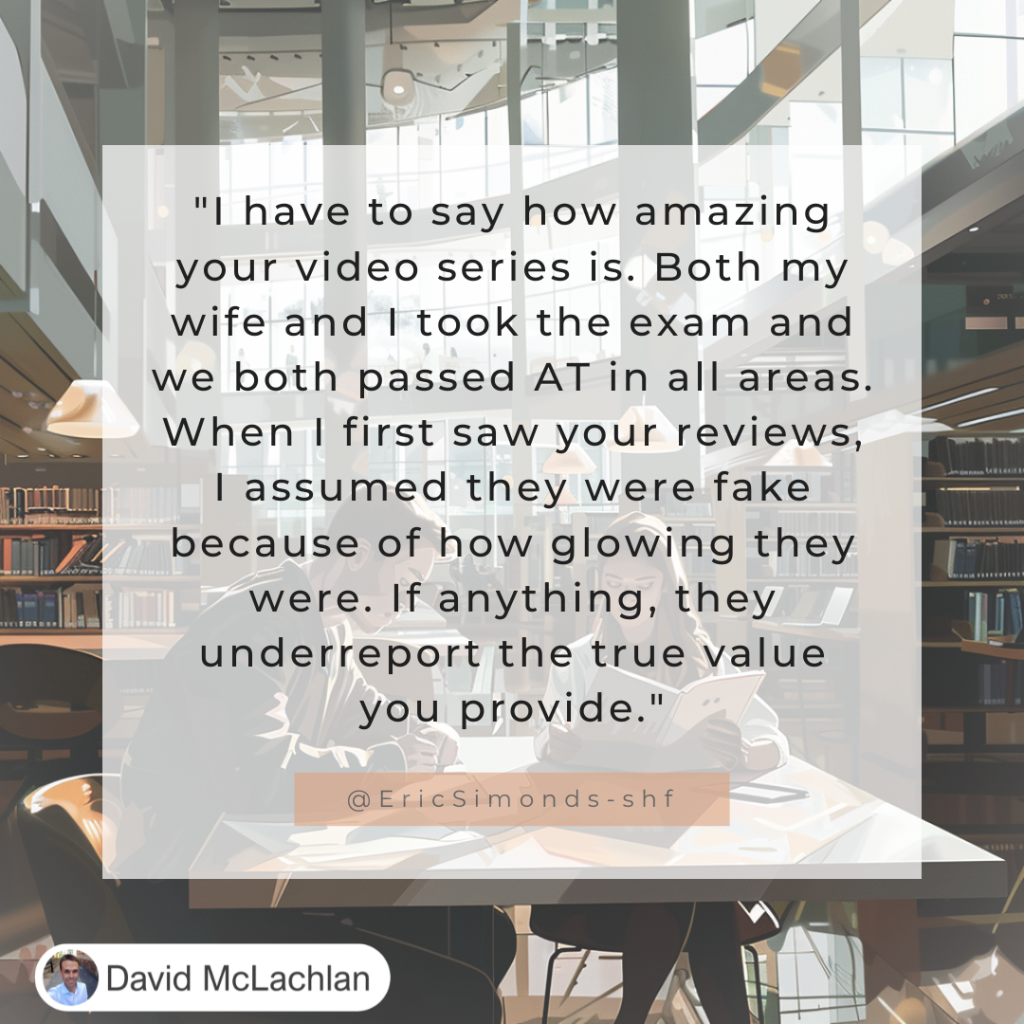
“I have to say how amazing your (David McLachlan’s) video series is. Both my wife and I took the exam and we both passed AT in all areas. When I first saw your revies, I assumed they were fake because of how glowing they were. If anything, they under-report the true value you provide.” – Eric

David McLachlan Review

“Hi David McLachlan, I passed PMP this week with 3 ATs. Thanks a lot for the humongous effort that you have put in to make things clear for us. You made me understand the concept so well. Thanks again David.” – Rekha

David McLachlan Review

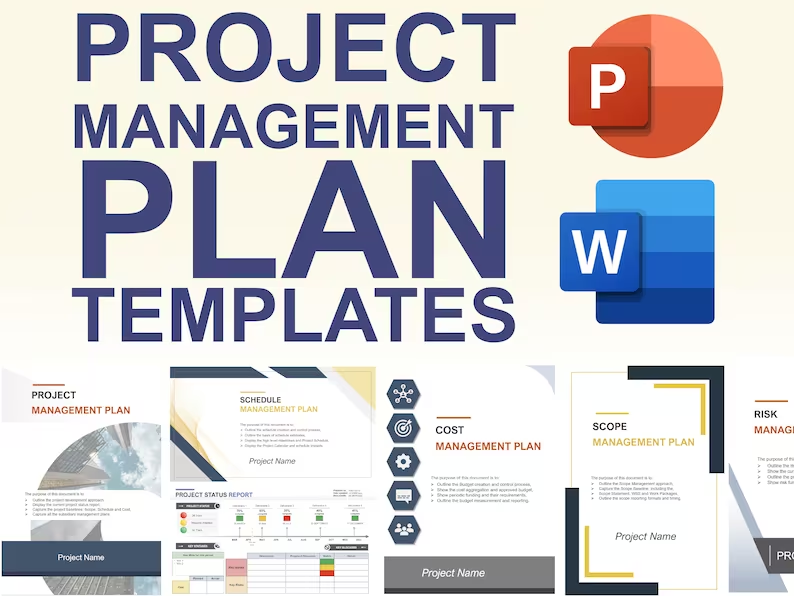
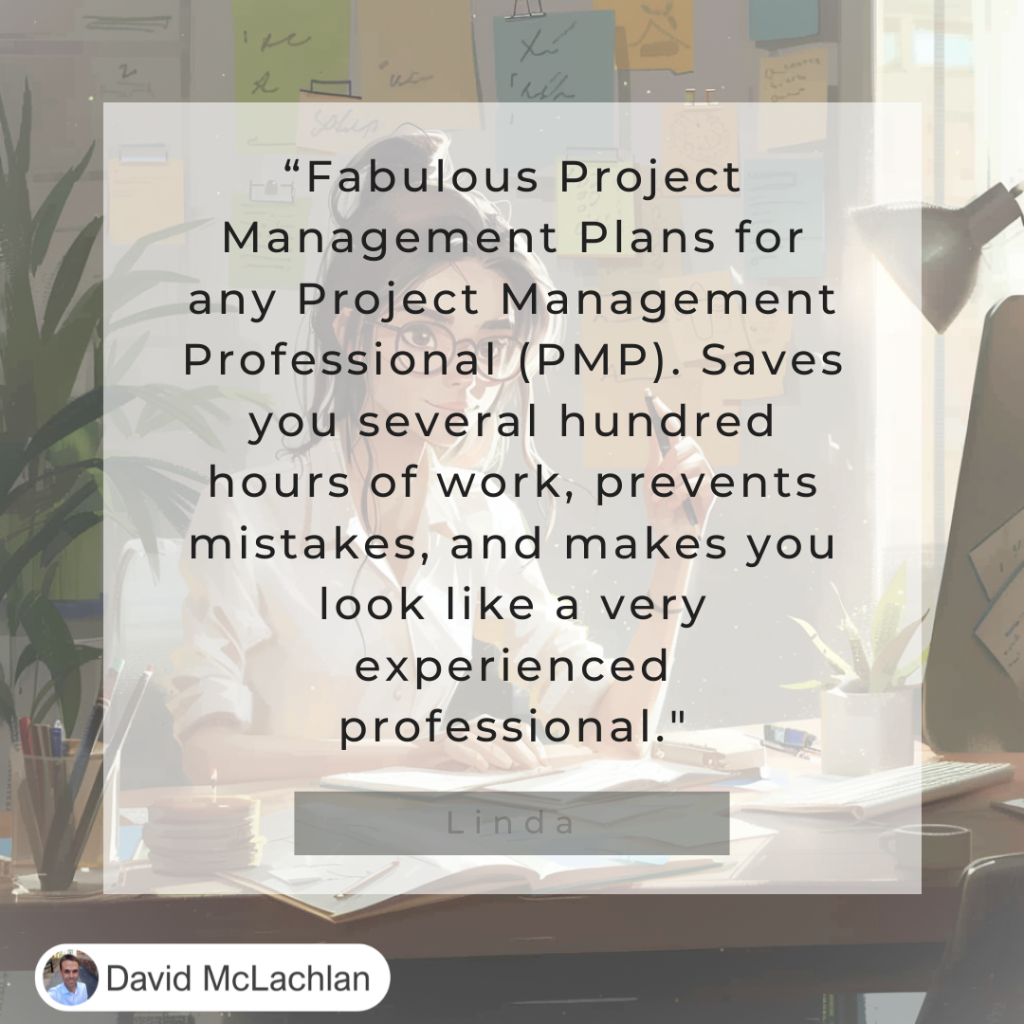
“Fabulous Project Management Plans (by David McLachlan) for any Project Management Professional (PMP). Saves you several hundred hours of work, prevents mistakes, and makes you look like a very experienced professional.” – Linda

David McLachlan Project Plans Review

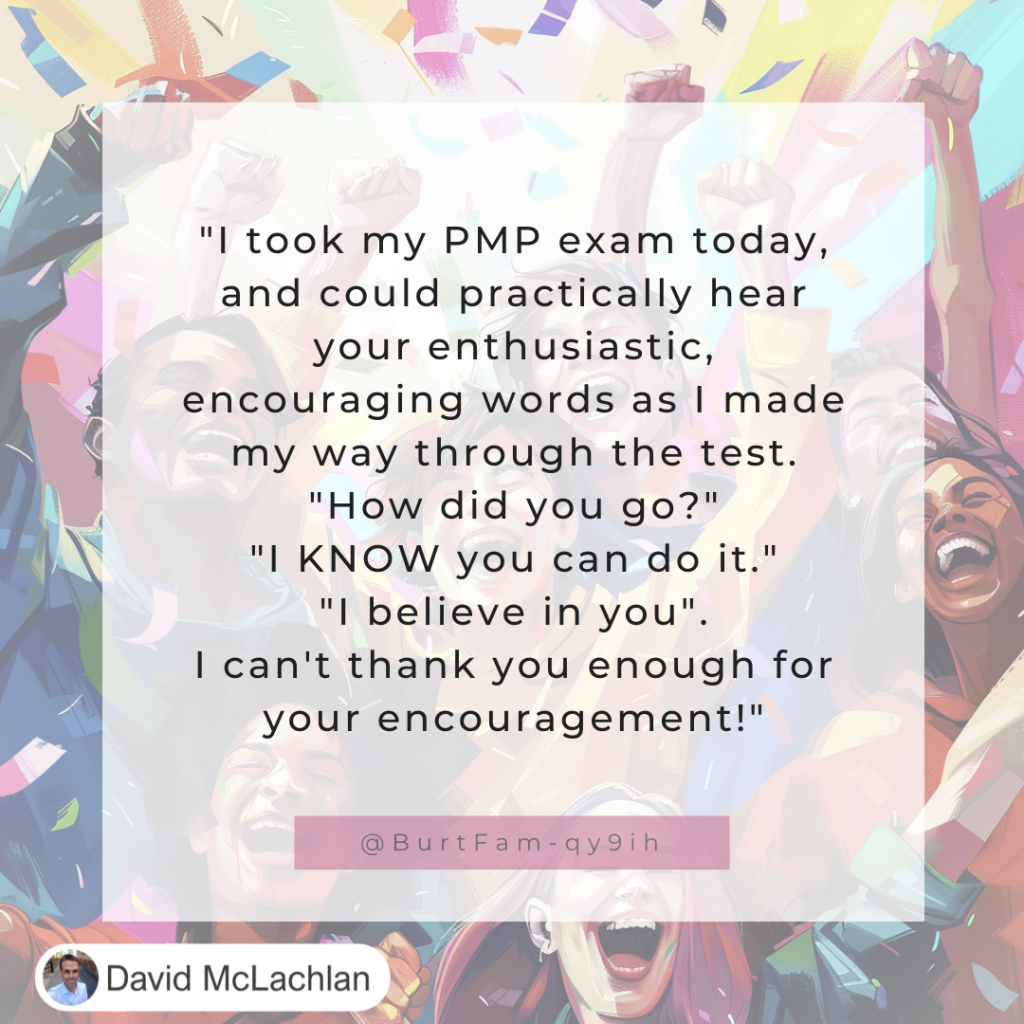
“I took my PMP exam today, and could practically hear (David McLachlan) your enthusiastic, encouraging words as I made my way through the test. “How did you go?” “I KNOW you can do it.” “I believe in you.” I can’t thank you enough for your encouragement!” – Burt

David McLachlan review

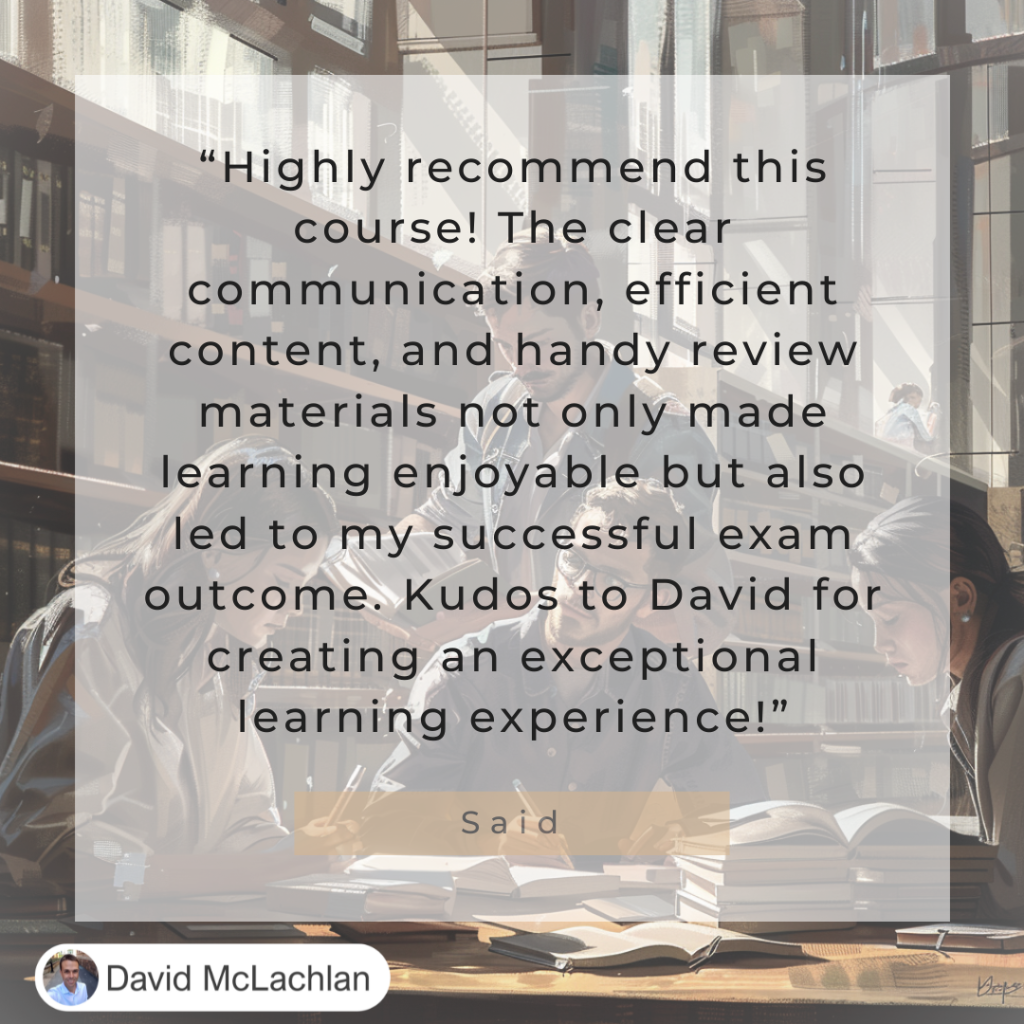
“Highly recommend this (David McLachlan) course! The clear communication, efficient content, and handy review materials not only made learning enjoyable but also led to my successful exam outcome. Kudos to David for creating an exceptional learning experience!” – Said K.

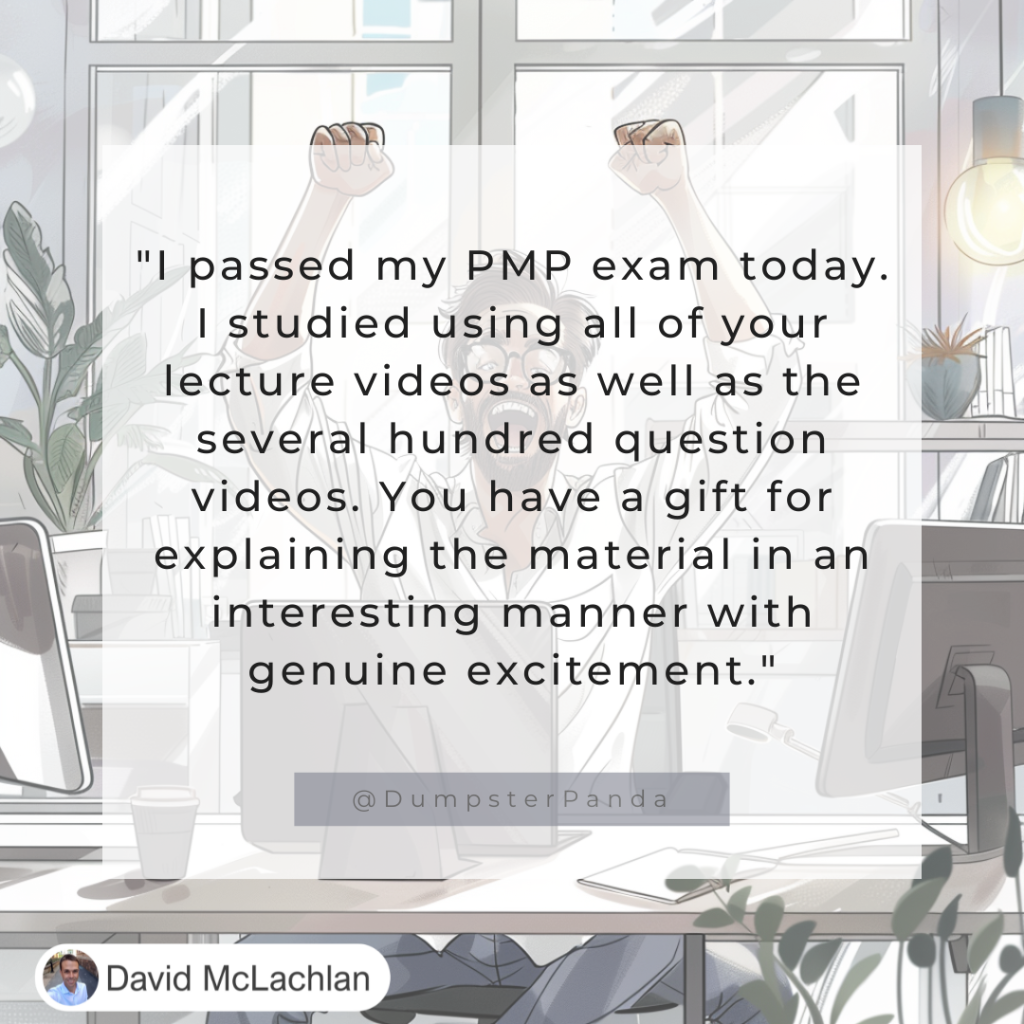
“I passed my PMP exam today. I studied using all of your (David McLachlan) lecture videos as well as the several hundred question videos. You have a gift for explaining the material in an interesting manner with genuine excitement.” – DP

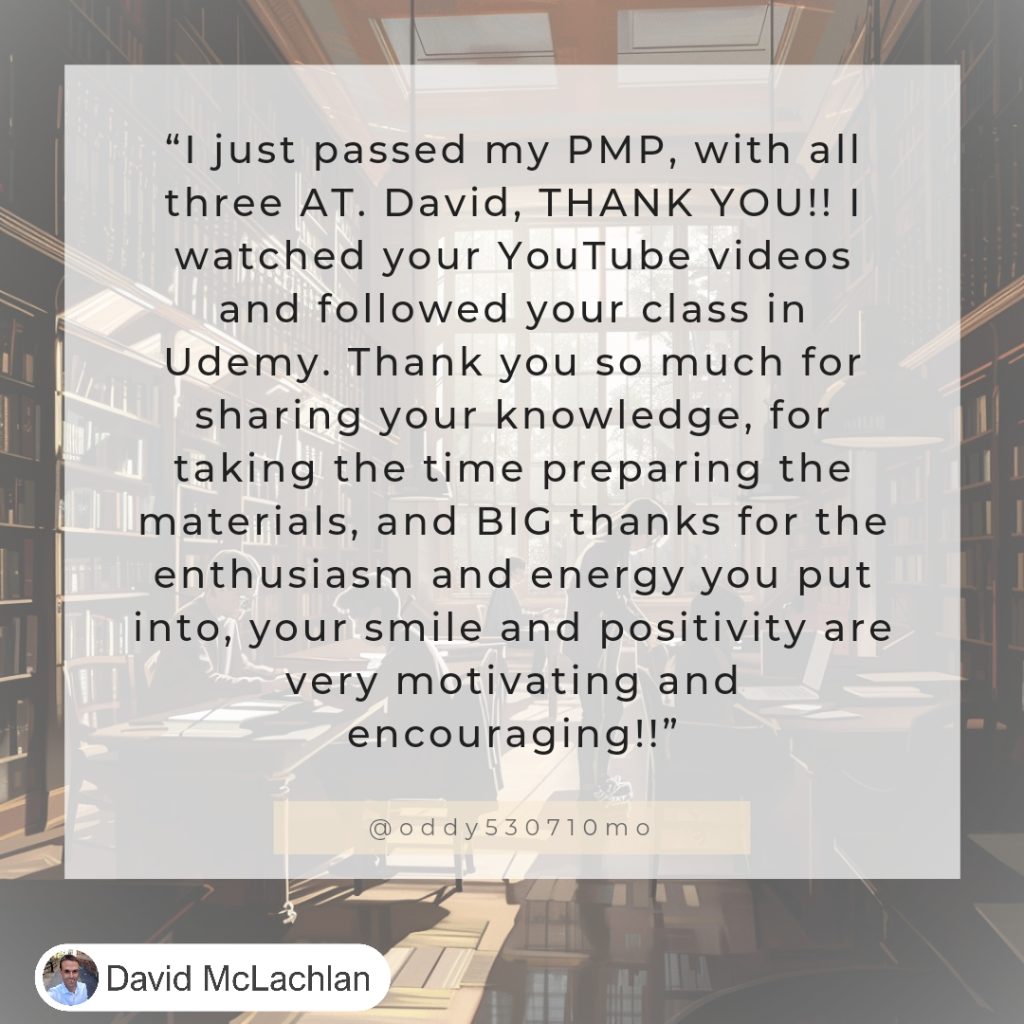
“I just passed my PMP, with all three Above Target. David McLachlan, THANK YOU!! I watched your YouTube videos and followed your class in Udemy. Thank you so much for sharing your knowledge, for taking the time preparing the materials, and BIG thanks for the enthusiasm and energy you put into, your smile and positivity are very motivating and encouraging!!” – Oddy

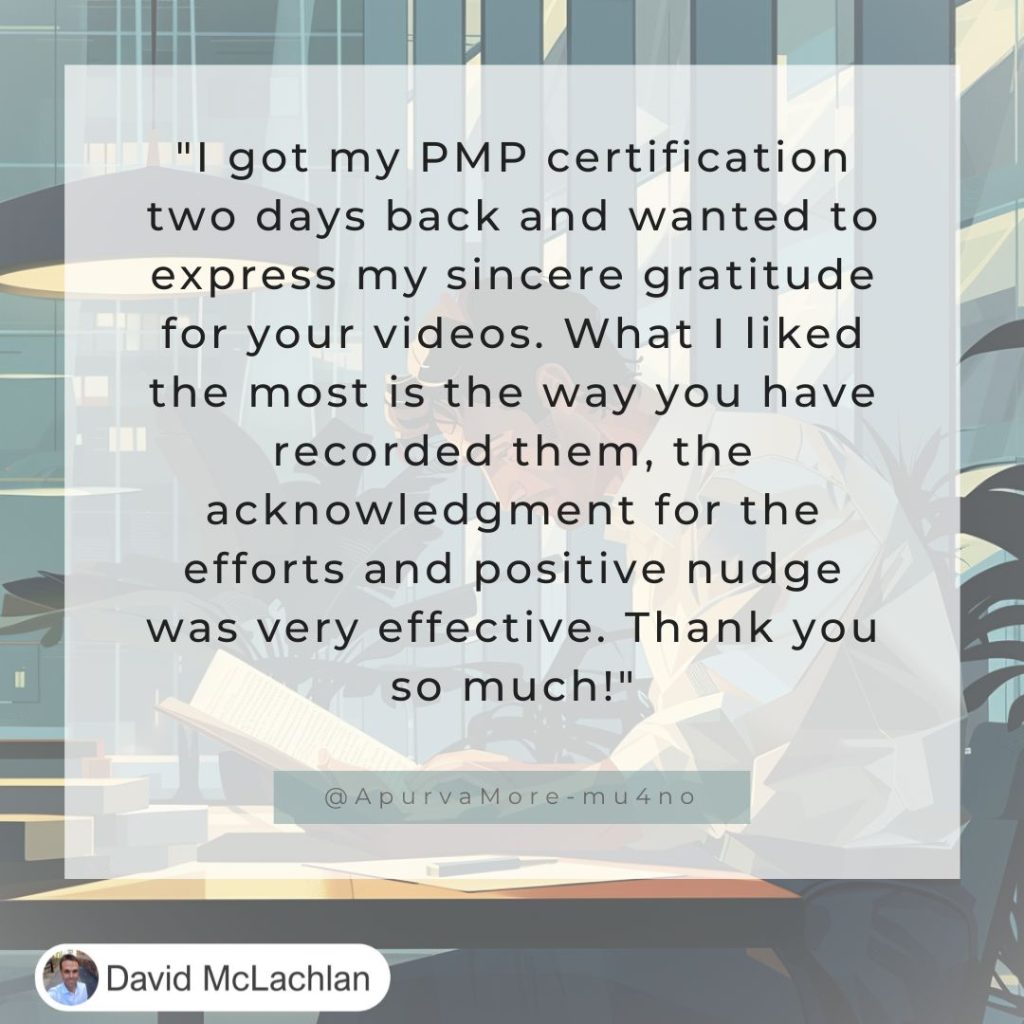
“I got my PMP certification two days back and wanted to express by sincere gratitude for your videos David McLachlan. What I liked the most is the way you have recorded them, the acknowledgement for the efforts and positive nudge was very effective. Thank you so much!” – Apurva

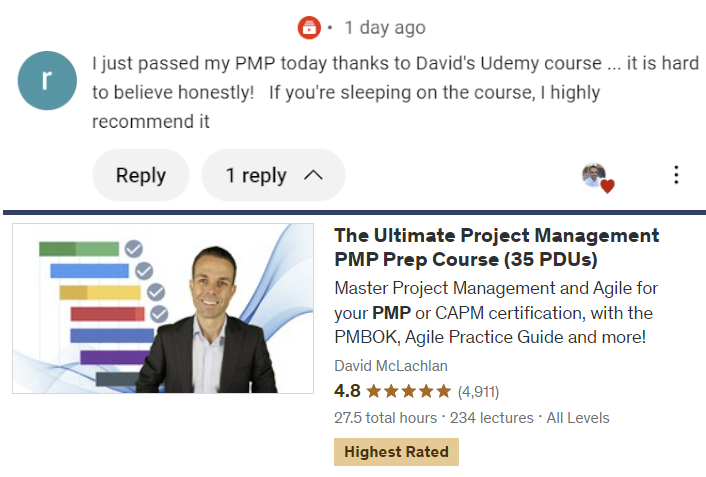
“I just passed my PMP today thanks to David’s Udemy course … it is hard to believe honestly! If you’re sleeping on the course, I highly recommend it.”

David McLachlan’s PMP Udemy Course is currently the highest rated PMP Course on Udemy.

David McLachlan PMP Udemy Review

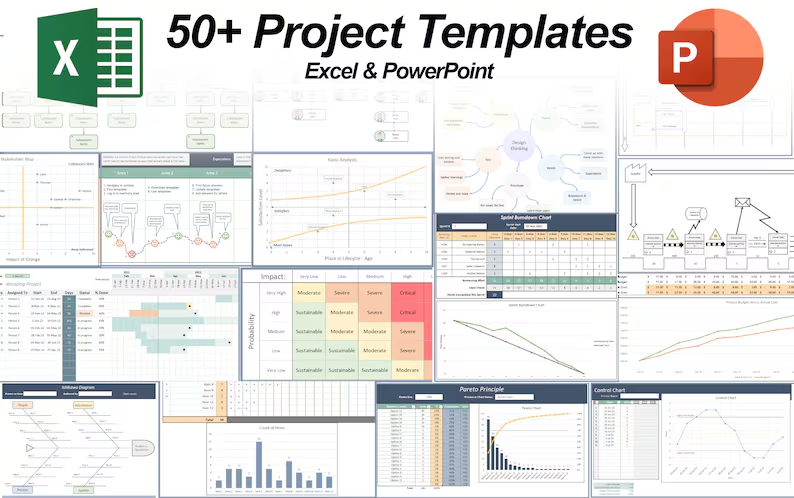
See what people are raving about! Get the Project Plans, Project Tools in Excel, Udemy PMP Course or Udemy Agile course here:

PMI PMP 35 PDUs CourseThe Ultimate PMP Project Management Prep Course (35 PDUs)
Agile Certified Practitioner (PMI-ACP 21 PDUs)The Complete Agile Course: PMI-ACP (21 PDUs), Coaching, Jira and MORE! 
50 Project Management Templates Gantt Chart Risk Matrix and more Excel50+ Project Management Templates in Excel and PowerPoint (Gantt Chart, Risk Matrix and more!)
Project Management Plan TemplatesPre-made Project Management PLAN Template: Save 100 HOURS!


How to Make a Lean A3 – Project on a Page

How to Make a Lean A3 Project on a Page

A Lean A3 is a project summary on a page. It tells the story of your change, improvement or project from the time it is just an idea all the way through to delivery and implementing the change. It also shows the main people involved, the data and reasons for the improvement, and a high level schedule for making the improvement.

It follows the “Deming Cycle”, of Plan, Do, Check, and Act (or Adjust). Check out the video to create your own PDCA Lean A3 in PowerPoint below!

Step 1

First create the heading area, by Inserting a Square shape, and colouring it grey.

Place two tables over the heading area, both without a “header” and unchecking banded rows. Turn these into our people and schedule list.

Plan Do Check Act picture 1

Step Two

Create seven more squares underneath this as our plank PDCA template,which will include the seven problem solving steps of a Lean PDCA A3. These are:

  1. Define the problem
  2. Grasp the current situation
  3. Plan
  4. Do
  5. Check
  6. Act (or Adjust)
  7. Lessons Learned

Lean A3 PDCA Blank Template

Step 3

Now we can fill in the Lean A3. For each step:

  1. Gather data and the “Gap” between where you are and where you want to be
  2. Use Value Stream Maps, process maps, Pareto charts, Fishbone diagrams to grasp the current situation and potential root causes
  3. Create an action plan based on the root causes, assign actions to people and give due dates.
  4. Show the schedules and actions in progress using a Gantt chart or Kanban board.
  5. Check your measures – what were you aiming for, and what was achieved?
  6. Update the Standard Operation Process (SOP) with the new process
  7. Perform a project Post-mortem, Retrospective, and gather lessons from the project.

Lean A3 PDCA Complete Template

– David McLachlan

How to Make a Sprint Burndown Chart in Excel

How to Make a Sprint Burndown Chart in Excel

A burndown chart is a tool from Agile, where all the “Stories” or items of work to be completed in a given iteration (a two-week time frame), with their accumulated points (how small or large each story is) are shown on a chart as the points are completed, from their total at the beginning to zero at the end of the iteration.

This video and article shows how to make a sprint burndown chart in Excel. Enjoy!

Step 1

First add the general framing and colours to your sheet:

Sprint Burndown Chart in Excel 02

Step 2

Next, fill out the backlog IDs, feature or story names, dates, and points as necessary.

Sprint Burndown Chart in Excel 03

Step 3

Now we can add in the formulas for Remaining Effort, Ideal Trend, and Points Completed This Sprint:

  • Remaining Effort: First =SUM(D7:D18), then =D19-SUM(E7:E18)
  • Ideal Trend: =D20-($D$20/COUNT($E$5:$N$5))
  • Points Completed This Sprint: =SUMIF(E7:N11,”> 0″)

Sprint Burndown Chart in Excel 04

Step 4

Now we can create the burndown chart. Select Remaining Effort and Ideal Trend rows, go to Insert > Line chart.

Sprint Burndown Chart in Excel 05

And now you have a beautiful sprint burndown chart in Excel!

Sprint Burndown Chart in Excel 01

How to Make a Customer Journey Map in Excel

How to Make a Customer Journey Map in Excel

A Customer Journey Map is a brilliant way to discover pain points in your customer’s journey, as they buy your product or service.

It notes the different areas (such as customer service points, digital apps or web pages) that a customer will travel through, the different process steps in each area, then rates their experience at each point from 1 to 10. Each rating is given a nice “emoji” icon (Happy or Sad), and a few notes on what the customer said at that point.

With all this it gives you a complete customer picture. It also allows us to find areas to improve, what features to deliver next, or where to focus our project on.

Enjoy!

Step 1

First setup the general framing and colours on your sheet:

Customer Journey Map in Excel 02

Step 2

Then add in the areas and process steps for each area that a customer will go through:

Customer Journey Map in Excel 03

Step 3

Note the customer satisfaction from 1 to 10 at each point in the journey.

Create the emojis by going to Home > Insert > Shapes, and insert a curved line and a circle together, to make a face. Right click them and group them together.

Customer Journey Map in Excel 04

Step 4

Add in the customer comments so you can see exactly where to improve.

And now you have a beautiful Customer Journey Template made in Excel!

Customer Journey Map in Excel 01

How to Make a Product Comparison Template in Excel

How to Make a Product Comparison Template in Excel

Product or feature benchmarking is a key part of finding out where to go forward in your business.  It is easy to do with the right product comparison template. You simply write the features that you are looking at, down one side. Then you note the different companies (or areas, or products) along the top, and note whether they have that feature where the two parts intersect.

Before you know it, you have a clear idea of the companies or products that have the features you want. Here’s how you create one!

Step 1

First setup the general framing and colours for your sheet:

Product Benchmarking Template 01

Step 2

Next, add in “Wingdings 2” font, “O” and “P” letters, which will make ticks and crosses.

You can use conditional formatting to colour the “O”s and “P”s like this:

  • Home > Conditional Formatting > Cell Value Equal to “P” and “O”, changing the font colour for each.

Product Benchmarking Template in Excel 02

Step 3

Next add the “Ranking System”, with the formula:  =COUNTIF(C6:C37,”P”) at the top of each column.

You can add the right colours with Conditional Formatting:

  • Home > Conditional Formatting > Only Top or bottom Ranked Values (1)

Product Benchmarking Template in Excel 03

Now you have a beautiful Multi-Criteria Product Benchmarking template in Excel!

Product Benchmarking Template in Excel 04

Project Stakeholder Management Video Course

 – See All The Project Management (PMBOK) Video Lessons Here – 

Below you will find videos on all the Project Stakeholder Management sections from the PMBOK Guide.

If you want to see the “Key Concepts & Tools” for Project Stakeholder Management, click here. Enjoy!

Project Stakeholder Management Overview

Identify Stakeholders

Plan Stakeholder Engagement

Manage Stakeholder Engagement

Monitor Stakeholder Engagement

Well done for improving your knowledge on Project Management! If you want to see the “Key Concepts & Tools” for Project Stakeholder Management, click here. Enjoy!

 – See All The Project Management (PMBOK) Video Lessons Here – 

– David McLachlan