– See All Project Management Key Concepts –
 Management Reserves versus Contingency Reserves
Why are we talking about management and contingency reserves? Very simply, management reserves and contingency reserves are used for different reasons in your project and your project and budget, and they can get confused both in real life and during the PMP exam. It’s a good idea to make sure you have it clear as you will likely get a question on this in your PMP exam.
The Differences Between Management and Contingency Reserves
What are the differences? Management reserves are added to the overall cost baseline – let’s say we have the overall project cost baseline here, that’s our project cost and then we actually add a little bit on to the top of that as our management reserve. That is used for our “unknown unknowns”, things that we have not foreseen, things that we haven’t looked at, risks that we did not know about or that could happen, risks that were not planned.
Contingency reserves are another story. They’re actually used within the cost budget and the cost budget baseline and they’re allocated for risks that we have thought about, so we know that those risks potentially could happen. These are used in work packages or activities – the activities that our teams are performing to deliver a particular feature – and for those we attribute a cost, and the cost we add contingency reserves within each of those activities for any of the risks that we have looked at that we see that might be coming up as we go along in our project.
Let’s look at an example. As you can see on the left here we’ve got the total amount, the project budget all the way up here but what is that made up of? Well, we’ve got our cost baseline, our total cost and then the added management reserve for any of those “unknown unknowns”, the risks that we have not foreseen.
Then we’ve got all of the other items and our work packages over here. This is an estimate of our work package and in that we add our contingency reserve for any risks that we have looked at and that we know might be coming up – we’ve got a little bit of a contingency just in case they do these risks appear.
That all feeds into the cost base line, and then we add the management reserve on top of that. In another example as we’re going along on our project where we’ve actually exhausted our budget at completion (BAC), we can tap into that management reserve, and that is our final project budget including that management reserve of any of those unforeseen risks.
And that is the idea of project reserves for your project.
– David McLachlan
 Lead Time and Lag Time

 The critical path method, and calculating float using the forward and backward pass.
 Precedence Diagramming Method
 Rolling Wave Planning
 What is the Schedule Performance Index?
 Project Schedule Compression Techniques
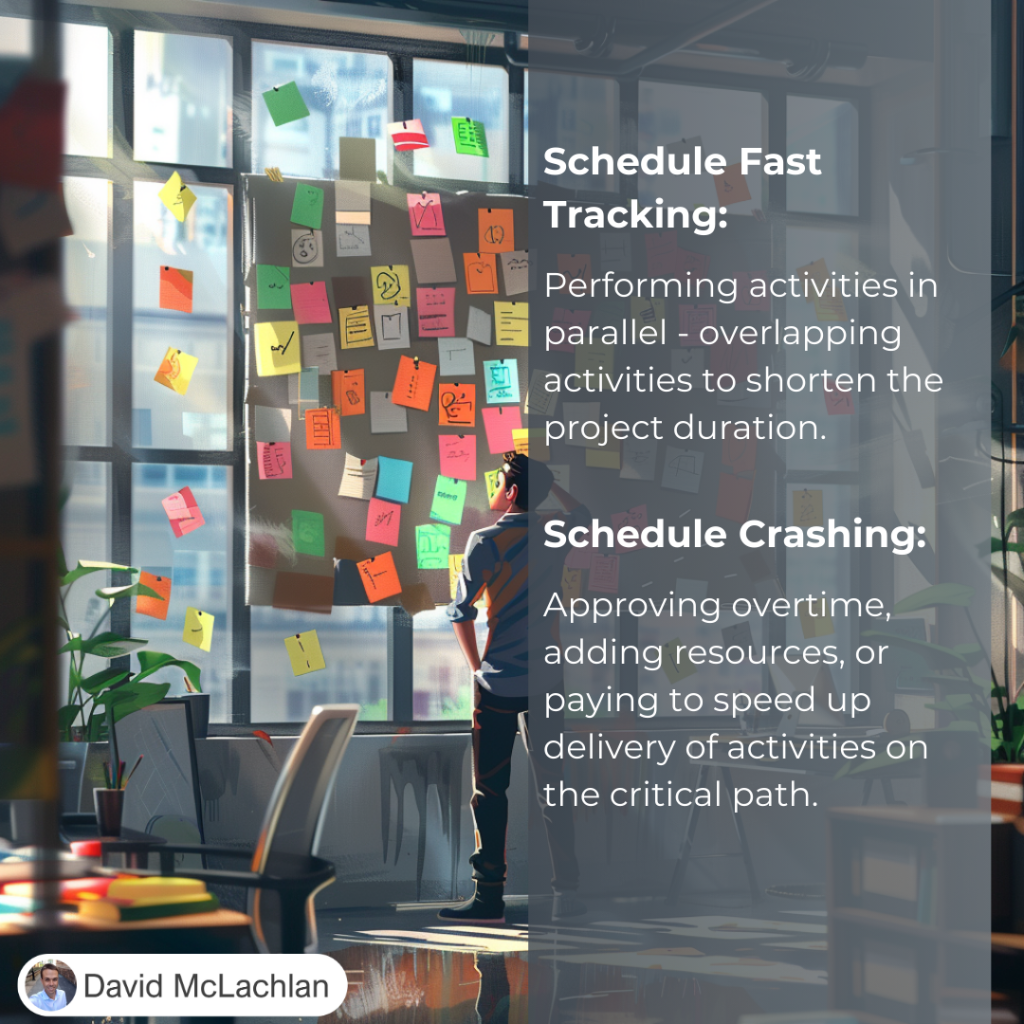
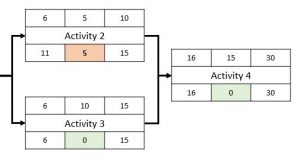 The Critical Path and Float
 What is Variance Analysis?